Management of these assets includes planning, design, procurement, maintenance, repair, refurbishment or replacement of sewer lines and equipment at pump stations and treatment plants to avoid sewer overflows, and to keep our staff and the public safe. WTD is committed to meeting all regulatory requirements and fulfilling our customer’s expectations while minimizing the total cost of the system.
Much of the King County wastewater treatment system is over 50 years with many assets reaching “end of life” each year. WTD uses objective and measurable criteria to prioritize asset management projects so that we can plan and forecast the maintenance or replacement of critical assets.
Status of key areas of Asset Management Program (August 2025)
WTD Assets
Asset Registry
The Asset Registry is the database of physical assets in our maintenance system. The database includes multiple attributes of our assets to help us maintain and analyze our value-added activities to extend useful life of the asset.
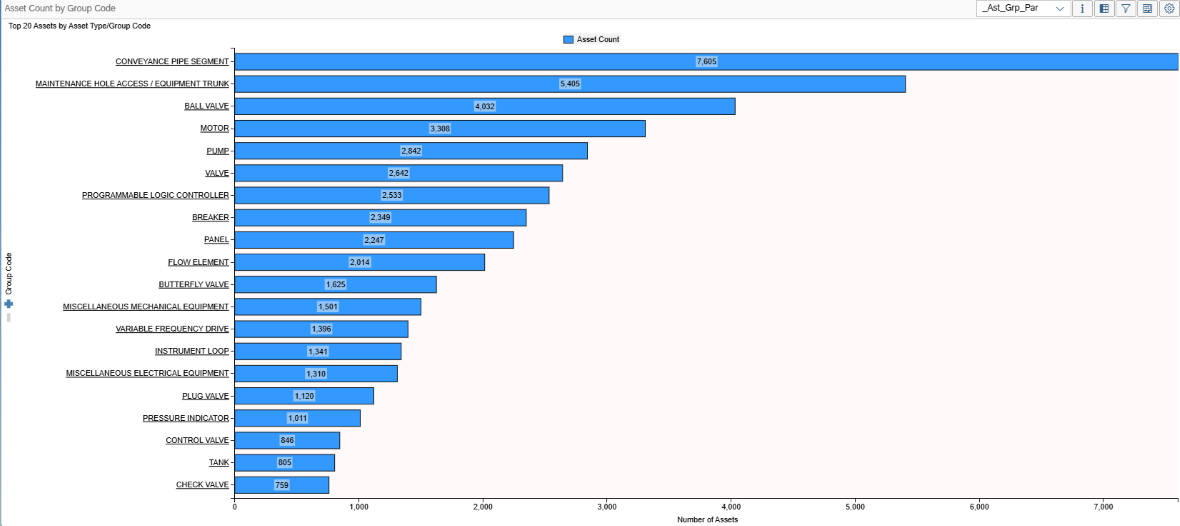
Below is a graph of the top 20 assets by asset type or group code.
Top 20 assets by Asset Type or Group Code
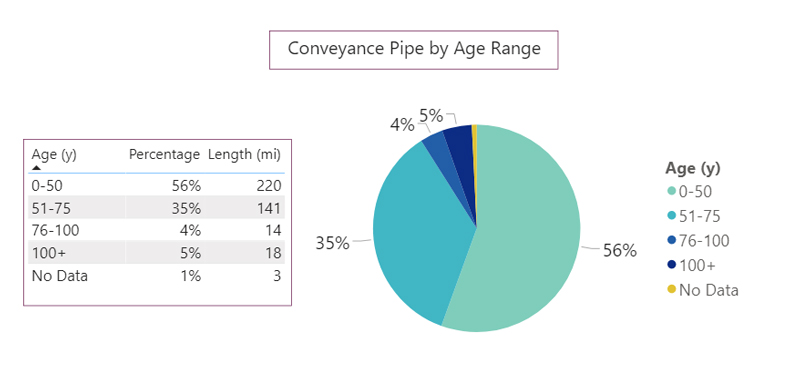
Conveyance Pipe Age
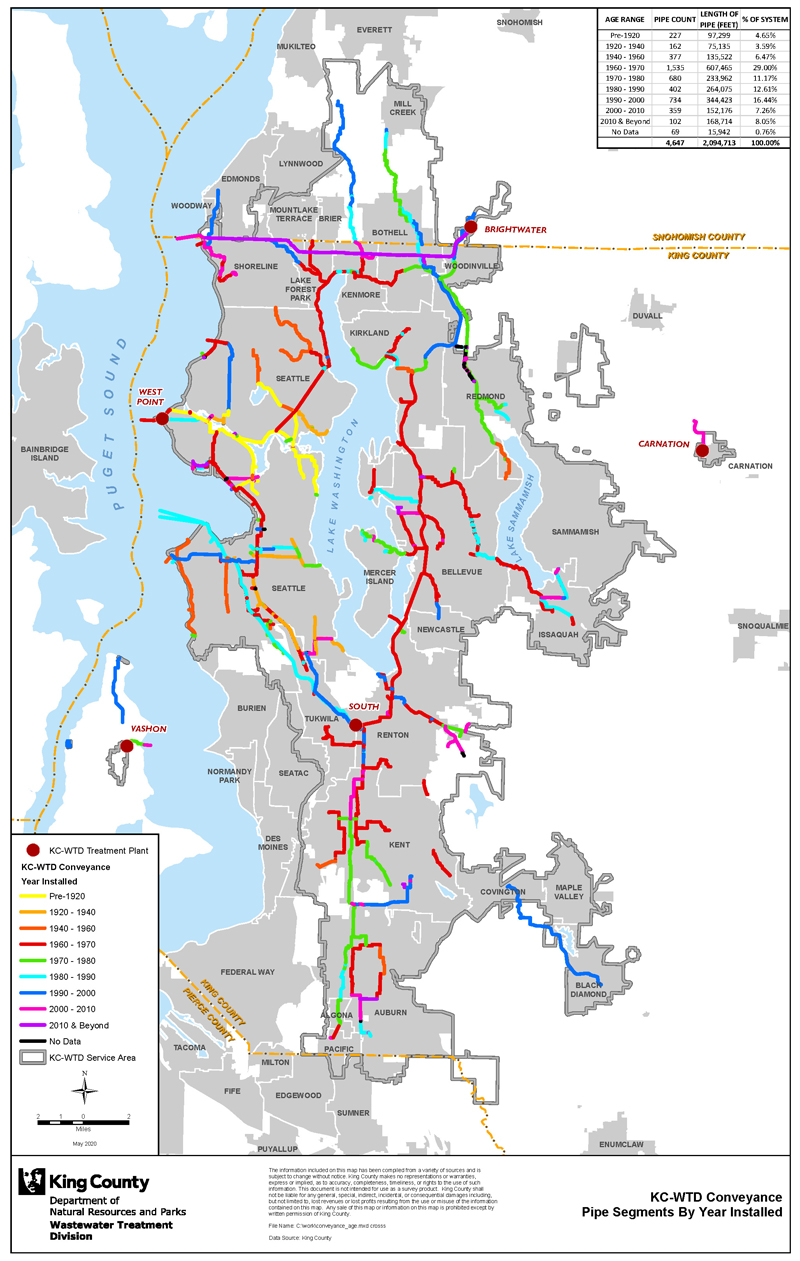
Conveyance Pipe by Age Range
KC-WTD Conveyance Pipe Segments By Year Installed
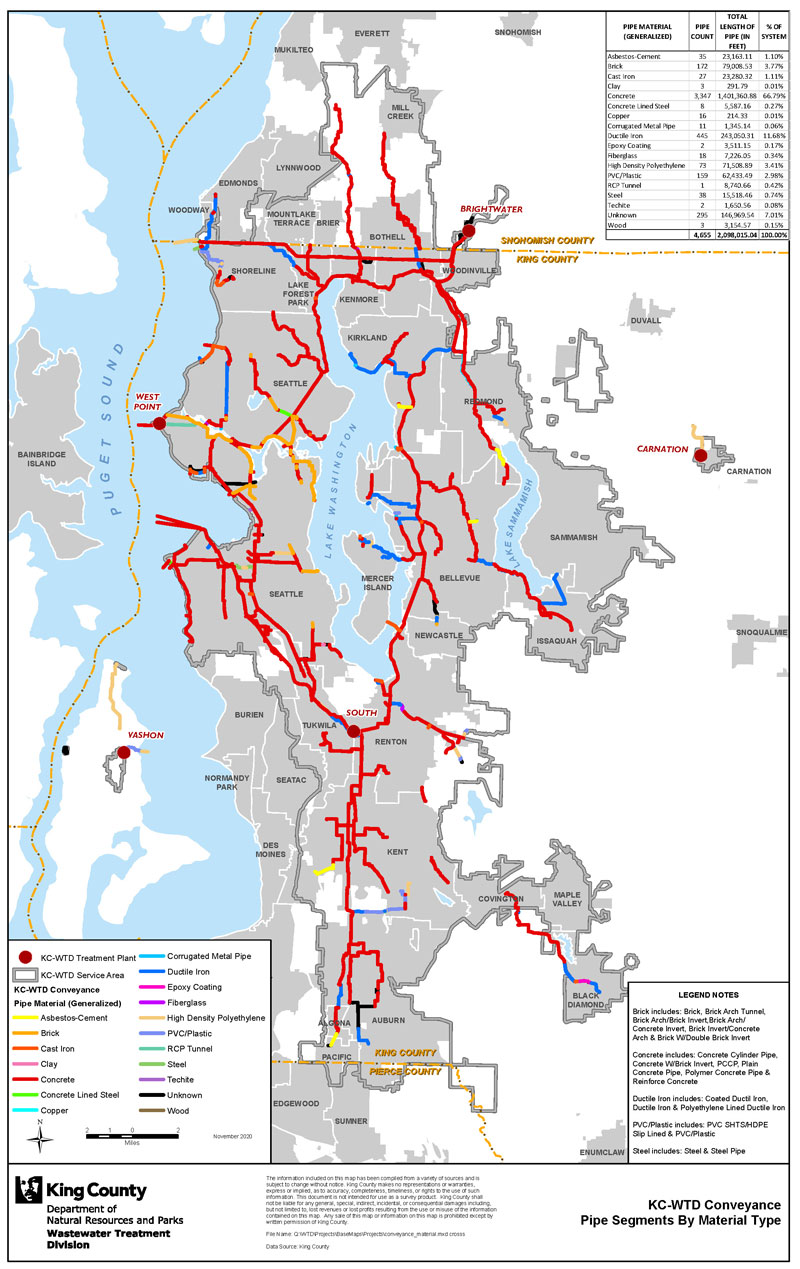
Conveyance Pipe Material
KC-WTD Conveyance Pipe Segments By Type of Material
How we maintain
Scheduling allows us to implement proactive maintenance strategies while simultaneously coordinating short-term/unexpected work. By measuring the accomplishment against the schedule we develop a weekly feedback loop to increase completion and address roadblocks. This helps us to:
- Review the backlog of work to make sure we are addressing the highest priority items.
- Coordinate maintenance activities with affected groups to promote efficiency (maintenance, operations, etc)
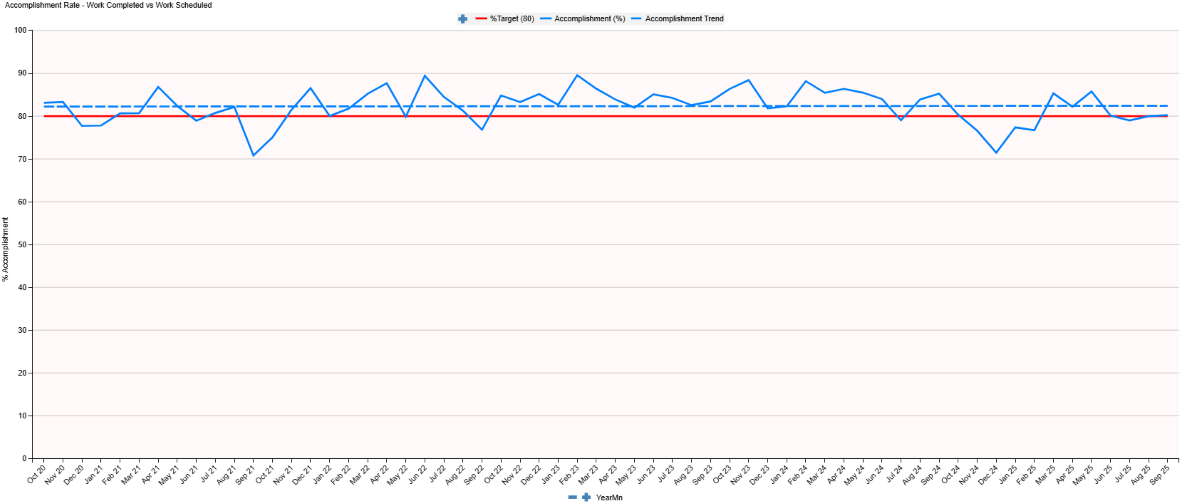
Below is a chart documenting the accomplishment rate.
Maintenance Work Accomplishment Rate – Work Completed vs Work Scheduled
Proactive activities are documented maintenance strategies that we have to avoid or detect failure before it affects our system. Reactive activities are when our assets are telling us what they need. We are always in a continuous improvement process to:
- Learn what our assets need to proactively address them
- Reduce our reactive maintenance to improve reliability and decrease operating costs
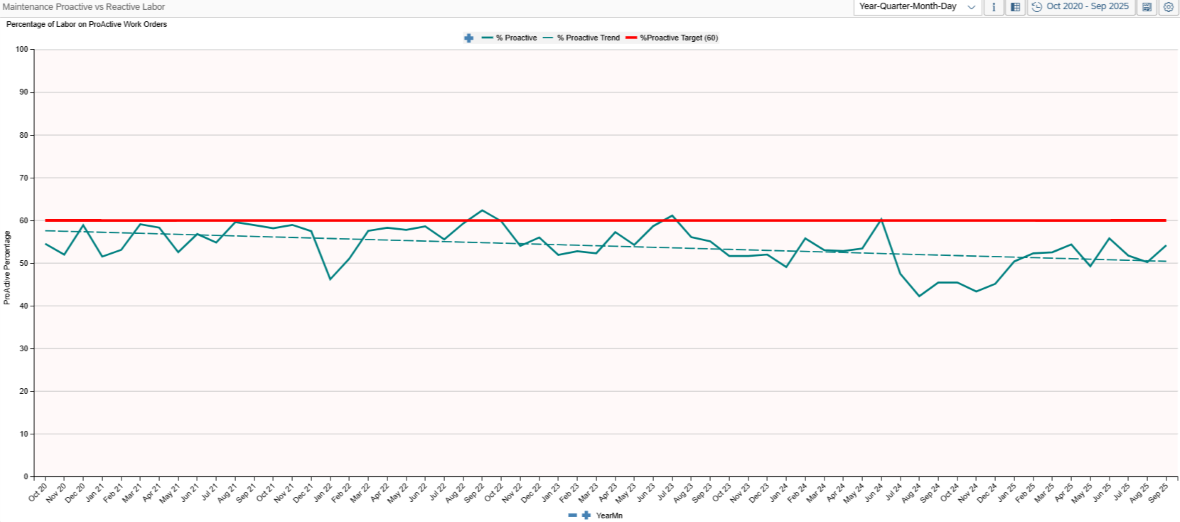
Below is a chart documenting the percentage of our labor hours against proactive work.
Percentage of Maintenance Labor on Proactive Work Orders
Eyes on our current assets
WTD is in the process of estimating the useful life of our 60,000 assets. This estimation allows us to:
- Determine a condition assessment cycle to assess both the individual asset and it’s estimated useful life.
- Proactively refurbish or replace them to maintain our high levels of service.
- Track assets to ensure needed work is completed and issues are addressed in a timely manner.
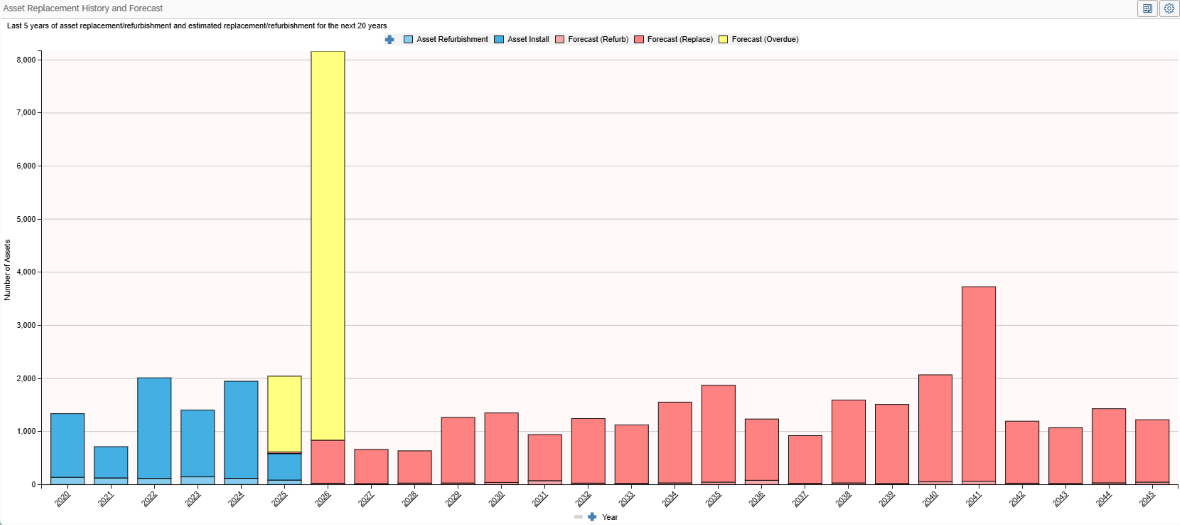
The graph below depicts the magnitude of assets refurbished or replaced in past years as well as a forecast (using the estimated useful life) of assets to be refurbished or replaced for planning purposes. Areas in yellow indicate backlog of assets that are operating beyond their estimated replacement/refurbishment date. These assets have a medium to low priority because they are still in good condition, meet performance standards and have a low criticality within the system. These assets may require increased maintenance attention to ensure reliability.
 Translate
