
 Translate
King County iMap
King County GIS Center is pleased to announce that the new King County iMap is now fully live! This is the third major redevelopment of iMap in its nearly 30-year history, and we are excited to launch the next generation iMap. The previous version is no longer available. We invite you to explore the updated tools, enjoy the modernized design, and continue sharing feedback as we enhance the experience.
Access the new iMap at https://kc-imap.kingcounty.gov
What you should know:
- The URL to iMap has changed to https://kc-imap.kingcounty.gov/
- The previous iMap URL is being redirected to this new URL
- You can pass a 10-digit parcel number into iMap’s URL by adding a `pin` value to the end.
For example: https://kc-imap.kingcounty.gov?pin=0942000860 - If you have already created links to iMap from your own applications, websites, reports, bookmarks, etc., they will continue to work, but we encourage you to update the URL at your earliest convenience.
Read more about the new King County iMap in this GIS & You blog post.
iMap is an application that allows you to view King County spatial information (GIS data and images) in an interactive map display. You can customize your map display to show just the information you want to see at the best scale for your chosen purpose. iMap is your window to a wealth of geographic information from throughout King County on such topics as real property, natural resources, political boundaries, planning, and much more.

iMap Guide
Getting Started with iMap
Search for a location
Use the Basic Search box in the upper right to find addresses, parcel numbers, street intersections, and common destinations and landmarks such as parks and school districts in King County. For addresses, one or more selection options may appear as you type and you may click on the one that matches your preference. For street intersections, to get a successful result, use an ampersand between street names like this: 80th & Roosevelt.
Look up property information
Zoom to an address or parcel number using Basic Search or using the zoom and pan tools to navigate to it. Click the parcel and a pop-up window with property information will appear. Follow the links to the Assessor's Property Report or to the Districts Report.
Explore different map layers
There are more than a dozen theme-based layer groups to choose from in the Layer List. Expand a layer group by clicking on the arrow. Display or hide layer groups and individual layers by clicking the check boxes next to their names. Important: a group layer needs to be checked on to see any of the individual layers in that group display on the map.
Try different basemaps
A basemap is the background for your map. Open the Basemap gallery and click on one of the map thumbnail images to change the basemap. In addition to a standard basemap made with authoritative King County data, there are several vintages of aerial photo imagery, a hillshade basemap that represents landforms, and several third-party basemaps, including OpenStreetMap.
iMap Interface
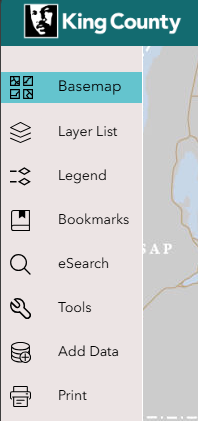
iMap has a new set of widgets and tools located in the left panel of the map.
Here you'll find the Basemap Gallery, Layer List, Legend, Bookmarks, an Enhanced Search tool, Tools for measuring and drawing, a tool to add your own data, and options for printing a map.
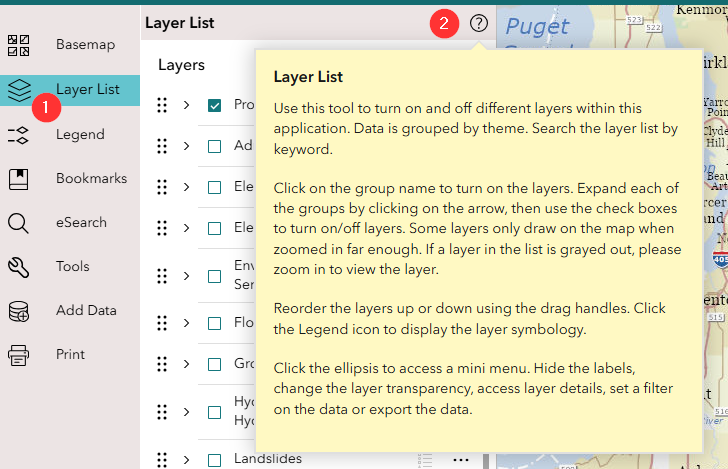
Each widget has a Tooltip located in the upper-right corner of the widget header. Click the ? for instructions on its use.
Basemap Gallery
Basemaps are the foundational backgrounds that provide context for a map.
Use this tool to select different basemaps. Choose from multiple years of historic aerial imagery, the standard cartographic basemap, as well as topographic basemaps. You cannot directly interact with the layers that make up a basemap.
Layer List
Use this tool to turn on and off different layers within this application. Data is grouped by theme. Search the layer list by keyword.
Click on the group name to turn on the layers. Expand each of the groups by clicking on the arrow, then use the check boxes to turn on/off layers. Some layers only draw on the map when zoomed in far enough. If a layer in the list is grayed out, please zoom in to view the layer.
Reorder the layers up or down using the drag handles. Click the Legend icon to display the layer symbology.
Click the ellipsis to access a mini menu. Hide the labels, change the layer transparency, access layer details, set a filter on the data or export the data.
Legend
The Legend shows the symbology for layers that are currently turned on and visible in the map. Turn on and off layers in the Layer List and the Legend will update.
Bookmarks
Bookmarks allow you to save the geographic extent on the map so you can return to locations of interest. If you would like to save your current view of iMap, click the '+' tile to add a bookmark. This saves the currently displayed zoom extent of the map.
Note: Bookmarks that you add are saved in your browser's history. They will be visible to you after closing and re-opening iMap. However, if you erase your browsing data, or if your browser does this periodically by default, then your bookmarks will be deleted.
eSearch (Enhanced Search)
Enhanced search is the main tool used for finding and selecting features on the map. Use the Query tab to search by attributes. Use the Spatial tab to search by spatial operations or draw/sketch a shape on the map to select features. Use the Results tab to review the searched features or to export the results to a table.
Tools
- Measure: The measure tool allows you to quickly measure distances and areas in the map. Select either the distance or area measurement tool and follow the instructions to place your first point. Once the point is placed, you can adjust the units of measurement. You can find the perimeter of a feature by using the distance measurement tool to trace around its edges.
- Draw: Use the draw tool to add illustrations such as points, lines, polygons, and text to the map. Each draw tool type can be configured to include location or measurement option. Use the Select feature tool to select and edit each drawing as needed. Note that associated measurement labels are not editable. You can save your drawing with the Export drawings tool and import drawings from a file using the Append from file tool. The Clear all tool removes all illustrations from the map. Use the Settings tool to enable tooltips and determine how your drawings will line up with the map layers.
Add Data
The Add Data tool allows you to add additional map layers to your map. The data can come from a variety of sources including ArcGIS Online or, if under 1,000 records, a local file. The added data layers will be listed in the Layer List and act like other layers in your map until you remove them. When reopening iMap, confirm the layers are in the Add Data widget, then open the Layer List to interact with them. Acceptable data source types are identified in the Search, URL and File sections of the tool.
The Print tool lets you enter options and then create a map that you can print or save. Once you have updated your map to your liking, choose the options in the Print template section of the tool. Expose the Advanced section to update the title and scale bar unit. When you are ready, press Print at the bottom of the tool. Your map will be available for download in the Results tab.
How do I...
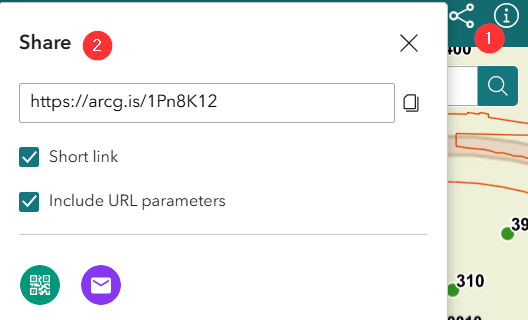
Use the Share button in the upper-right corner of the map. Copy the link, which preserves the layers drawn, the extent of the map, and any selection made.
The Cursor Coordinates Tool, which is located along the left lower edge of the map, shows the latitude and longitude in decimal degrees for the current location of your cursor. The coordinates display is dynamic—as you move your cursor, the coordinates will keep changing.
If you want to note the coordinates of a specific point on the map, click the cursor icon then click on the map. The coordinates tool will display the coordinates for that point, and the coordinates will be frozen until you click on the map again. Click the Copy icon to copy the coordinates to the clipboard.
To return to displaying cursor coordinates dynamically, just click on the cursor coordinates icon again.
If you hover your mouse over the drop-down arrow just to the right of coordinates, you will see an option to switch to displaying State Plane coordinates. (The full coordinate system name is shown, i.e., NAD_1983_HARN_StatePlane_Washington_North_FIPS_4601_Feet. This is the coordinate system in which King County GIS data is stored, EPSG 2926). Eastings and northings in feet are displayed in that order. State Plane coordinates cannot be displayed dynamically. To return to dynamic coordinates display when in State Plane mode, hover over the drop-down arrow again and select the Mercator option (full name: WGS_1984_Web_Mercator_Auxiliary_Sphere).
-122.33133; 47.59959
- Turn on the "Flooding Info" layer group by clicking or tapping the checkbox next to its name. You can expand the layer group by clicking or tapping the arrow to the left of the checkbox to verify that the layer "FEMA 100-year floodplain" is turned on.
- Enter the address of the property you are checking into the Basic Search entry field in the upper-right corner of the map and hit Enter. Or, click or tap the address in the drop-down list that appears; the map will zoom to the address. Instead of entering an address, you could just pan and zoom on the map to focus on your area of interest.
- Visually inspect the map to see where the property lies in relation to the floodplain. If the property is far outside a floodplain, you might need to zoom out to see the nearest floodplain. Also, the "Parcels" layer is turned on by default when you launch iMap, so you should see the parcel boundary for the property you are checking. (If not, go to the "Property Layers" layer group in the Layer List, and turn on the Parcels layer.) Click inside the parcel boundary on the map to highlight the parcel and confirm.
iMap User Questions
Q. I can't find the map layer I want to see.
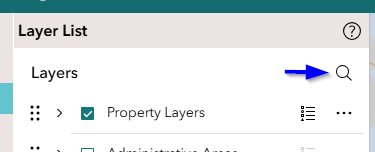
A. There are currently more than 150 map layers in iMap collected into over a dozen thematic layer groups. When you open the Layer List panel you see the layer group names. Click the arrow next to the name to expand a list of individual map layers that are collected in that group. Additionally, use the new Search tool at the top of the Layers list to search by name.
Q. I see the map layer I want to view in the Layer List, but it doesn't appear on the map.
A. In order to be visible, an individual map layer needs to be checked on AND the layer group that it is part of also needs to be checked on.
Q. I want to be able to zoom in more to see more detail. Can you make iMap do that?
A. iMap has fixed-scale map zoom levels and each zoom changes the map scale by a factor of two. We have added one larger-scale zoom level since iMap's launch and we don't have any immediate plans to add more. However, the current maximum zoom level corresponds to the full resolution of the 2025 aerial imagery basemap, so zooming in more would not reveal any additional photo detail.
Q. The basemap doesn't appear in my print map.
A. This may occur when the map view is at the maximum zoom level. Zoom out one level and then try a new map print.
Q. I no longer find links to the Assessor's Report and the Districts and Development Report.
A. If you do a basic search for an address, iMap will zoom in to a location and highlight the address. But you must then click on a parcel in order to see a pop-up that displays information about that parcel, including the familiar links to the Assessor's Report and the Districts and Development Report. Alternatively, if you do an Enhanced Search for a parcel, the result displayed in the Enhanced Search panel will include two links, one for each of the reports.